ESG Library ESG Data
Environment
CO₂
This table can be scrolled sideways.
| Entire Portfolio | Unit | FY 2018 | FY 2019 | FY 2020 | FY 2021 | FY 2022 | |
|---|---|---|---|---|---|---|---|
| Total CO₂ emission | t-CO₂ | 15,253 | 18,318 | 15,892 | 14,833 | 8,939 | |
| Scope1 | 2,411 | 2,930 | 2,473 | 764 | 795 | ||
| Scope2 | 12,842 | 15,389 | 13,420 | 4,362 | 1,734 | ||
| Scope3 | - | - | - | 9,707 | 6,410 | ||
| CO₂ emission intensity | t-CO₂/㎡ | 0.064 | 0.063 | 0.052 | 0.048 | 0.027 | |
| Residence | Unit | FY 2018 | FY 2019 | FY 2020 | FY 2021 | FY 2022 | |
| Total CO₂ emission | t-CO₂ | 3,955 | 3,959 | 2,897 | 2,326 | 433 | |
| CO₂ emission intensity | t-CO₂/㎡ | 0.041 | 0.040 | 0.029 | 0.023 | 0.004 | |
| Office Building | Unit | FY 2018 | FY 2019 | FY 2020 | FY 2021 | FY 2022 | |
| Total CO₂ emission | t-CO₂ | 7,362 | 10,039 | 9,719 | 8,684 | 5,842 | |
| CO₂ emission intensity | t-CO₂/㎡ | 0.063 | 0.063 | 0.058 | 0.050 | 0.032 | |
| Hotel | Unit | FY 2018 | FY 2019 | FY 2020 | FY 2021 | FY 2022 | |
| Total CO₂ emission | t-CO₂ | 3,936 | 4,320 | 3,276 | 3,823 | 2,664 | |
| CO₂ emission intensity | t-CO₂/㎡ | 0.147 | 0.125 | 0.089 | 0.104 | 0.106 | |
Energy
This table can be scrolled sideways.
| Entire Portfolio | Unit | FY 2018 | FY 2019 | FY 2020 | FY 2021 | FY 2022 | |
|---|---|---|---|---|---|---|---|
| Total energy consumption | MWh | 41,581 | 52,494 | 48,998 | 51,429 | 51,046 | |
| Electricity | 28,152 | 36,174 | 35,227 | 36,423 | 36,507 | ||
| Fuel | 13,249 | 16,319 | 13,772 | 15,006 | 14,539 | ||
| Energy consumption intensity | MWh/㎡ | 0.174 | 0.179 | 0.161 | 0.165 | 0.160 | |
| Residence | Unit | FY 2018 | FY 2019 | FY 2020 | FY 2021 | FY 2022 | |
| Total energy consumption | MWh | 8,181 | 8,352 | 8,219 | 8,343 | 10,009 | |
| Electricity | 8,181 | 8,352 | 8,219 | 8,343 | 9,892 | ||
| Fuel | - | - | - | - | 117 | ||
| Energy consumption intensity | MWh/㎡ | 0.085 | 0.085 | 0.083 | 0.083 | 0.090 | |
| Office Building | Unit | FY 2018 | FY 2019 | FY 2020 | FY 2021 | FY 2022 | |
| Total energy consumption | MWh | 20,459 | 28,180 | 28,041 | 29,138 | 30,157 | |
| Electricity | 13,657 | 19,388 | 19,865 | 20,388 | 21,212 | ||
| Fuel | 6,801 | 8,792 | 8,176 | 8,750 | 8,945 | ||
| Energy consumption intensity | MWh/㎡ | 0.176 | 0.176 | 0.166 | 0.167 | 0.164 | |
| Hotel | Unit | FY 2018 | FY 2019 | FY 2020 | FY 2021 | FY 2022 | |
| Total energy consumption | MWh | 12,941 | 15,961 | 12,738 | 13,948 | 10,880 | |
| Electricity | 6,313 | 8,434 | 7,143 | 7,692 | 5,403 | ||
| Fuel | 6,628 | 7,527 | 5,596 | 6,256 | 5,477 | ||
| Energy consumption intensity | MWh/㎡ | 0.483 | 0.461 | 0.347 | 0.380 | 0.432 | |
Waste
This table can be scrolled sideways.
| Entire Portfolio | Unit | FY 2018 | FY 2019 | FY 2020 | FY 2021 | FY 2022 | |
|---|---|---|---|---|---|---|---|
| Total waste emission | t | 1,055 | 1,045 | 714 | 696 | 884 | |
| Landfill | 357 | 357 | 200 | 57 | 10 | ||
| Incineration | 197 | 207 | 162 | 230 | 346 | ||
| Recycled | 501 | 481 | 344 | 351 | 523 | ||
| Reuse | - | - | - | 39 | - | ||
| Other | - | - | 8 | 18 | 4 | ||
| Waste emission intensity | kg/㎡ | 7.455 | 5.382 | 3.679 | 3.288 | 4.236 | |
| Office Building | Unit | FY 2018 | FY 2019 | FY 2020 | FY 2021 | FY 2022 | |
| Total waste emission | t | 871 | 869 | 618 | 602 | 695 | |
| Landfill | 244 | 248 | 144 | 57 | 10 | ||
| Incineration | 194 | 203 | 160 | 185 | 275 | ||
| Recycled | 433 | 418 | 306 | 308 | 405 | ||
| Reuse | - | - | - | 39 | - | ||
| Other | - | - | 8 | 13 | 4 | ||
| Waste emission intensity | kg/㎡ | 7.488 | 5.145 | 3.660 | 3,441 | 3.787 | |
| Hotel | Unit | FY 2018 | FY 2019 | FY 2020 | FY 2021 | FY 2022 | |
| Total waste emission | t | 184 | 176 | 96 | 94 | 189 | |
| Landfill | 113 | 109 | 56 | - | - | ||
| Incineration | 3 | 4 | 2 | 45 | 71 | ||
| Recycled | 68 | 63 | 38 | 44 | 118 | ||
| Reuse | - | - | - | - | - | ||
| Other | - | - | - | 5 | - | ||
| Waste emission intensity | kg/㎡ | 7.301 | 6.970 | 3.810 | 2.559 | 1.543 | |
Water
This table can be scrolled sideways.
| Entire Portfolio | Unit | FY 2018 | FY 2019 | FY 2020 | FY 2021 | FY 2022 | |
|---|---|---|---|---|---|---|---|
| Total water use | ㎥ | 780,360 | 876,419 | 845,551 | 819,330 | 866,107 | |
| Rainwater | 2,509 | 2,461 | 1,640 | 2,416 | 3,400 | ||
| City water | 777,851 | 873,958 | 843,911 | 816,914 | 862,707 | ||
| Water use intensity | ㎥/㎡ | 1.743 | 1.707 | 1.631 | 1.561 | 1.543 | |
| Residence | Unit | FY 2018 | FY 2019 | FY 2020 | FY 2021 | FY 2022 | |
| Total water use | ㎥ | 601,691 | 638,837 | 677,399 | 637,167 | 689,477 | |
| Rainwater | - | - | - | - | - | ||
| City water | 601,691 | 638,837 | 677,399 | 637,167 | 689,477 | ||
| Water use intensity | ㎥/㎡ | 1.976 | 2.004 | 2.166 | 2.034 | 1.954 | |
| Office Building | Unit | FY 2018 | FY 2019 | FY 2020 | FY 2021 | FY 2022 | |
| Total water use | ㎥ | 107,571 | 152,090 | 119,520 | 126,231 | 126,378 | |
| Rainwater | 2,509 | 2,461 | 1,640 | 2,416 | 3,400 | ||
| City water | 105,062 | 149,629 | 117,880 | 123,815 | 122,978 | ||
| Water use intensity | ㎥/㎡ | 0.925 | 0.950 | 0.708 | 0.721 | 0.689 | |
| Hotel | Unit | FY 2018 | FY 2019 | FY 2020 | FY 2021 | FY 2022 | |
| Total water use | ㎥ | 71,098 | 85,493 | 48,632 | 55,932 | 50,253 | |
| Rainwater | - | - | - | - | - | ||
| City water | 71,098 | 85,493 | 48,632 | 55,932 | 50,253 | ||
| Water use intensity | ㎥/㎡ | 2.655 | 2.471 | 1.325 | 1.524 | 1.993 | |
Renewable Energy
This table can be scrolled sideways.
| Unit | FY 2018 | FY 2019 | FY 2020 | FY 2021 | FY 2022 | ||
|---|---|---|---|---|---|---|---|
| Renewable energy consumption |
MWh | 11 | 229 | 2,031 | 6,602 | 20,592 | |
| Generated | 11 | 1 | 9 | 10 | 9 | ||
| Purchased | - | 228 | 2,022 | 6,592 | 20,582 | ||
Information Related to Calculation of Environmental Performance Data
Scope
Properties held as of the end of March every year for which SHR has energy management authority
(excluding properties disposed of during the period and areas for which it is difficult to acquire data because tenants have management authority, among other reasons)
Data Coverage(FY 2022)
| CO₂ | 42.6% |
|---|---|
| Energy | 45.1% |
| Waste | 27.5% |
| Water | 77.2% |
(Note) Data coverage is calculated as total floor space of properties subject to data acquisition / total floor space.
Aggregation Period
From April of each year to the end of March of the following year
(For water, the data is aggregated from January of each year to the end of December, from fiscal year 2022 onward.)
Reference Guidelines
Ministry of the Environment “Greenhouse gas emission calculation / reporting / publication system”
Ministry of the Environment and Ministry of Economy, Trade and Industry “Basic Guidelines on Accounting for Greenhouse Gas Emissions throughout the Supply Chain (ver. 2.4)”
Calculation Standards
This table can be scrolled sideways.
| Classification | Item | Calculation Method | |
|---|---|---|---|
| CO₂ | Amount of emissions | Scope1 | Direct greenhouse gas emissions by the business operator itself where the amount of activity (amount of fuel use) in common areas × the emission factor |
| Scope2 | Indirect emissions associated with the use of electricity, heat, and steam supplied from other companies where the amount of activity in common areas (amount of energy purchased) × the emission factor Note that Scope 2 is calculated on a market basis from FY 2021 |
||
| Scope3 |
Leased assets (downstream) in category 13 where the amount of tenants' activity (amount of fuel use and amount of energy purchased) in exclusive area × the emission factor Note that Scope 3 is calculated separately from FY 2021 |
||
| Intensity | CO₂ emissions/total floor area | ||
| Energy | Amount of consumption |
Amount of fuel use and energy purchased × Energy conversion factor Note that for city gas, 45 MJ/㎥ applies uniformly, and for others factor under the reference guidelines apply |
|
| Intensity | Energy consumption/total floor area | ||
| Water | Amount of usage | Total of rainwater and city water | |
| Intensity | Water usage/total floor area | ||
| Waste | Amount of emissions | Total amount of waste excluding valuables | |
| Intensity | Waste emissions/total floor area | ||
| Renewable Energy | Amount of usage | Total amount of renewable energy generated by solar power generation facilities at owned properties and purchased renewable energy | |
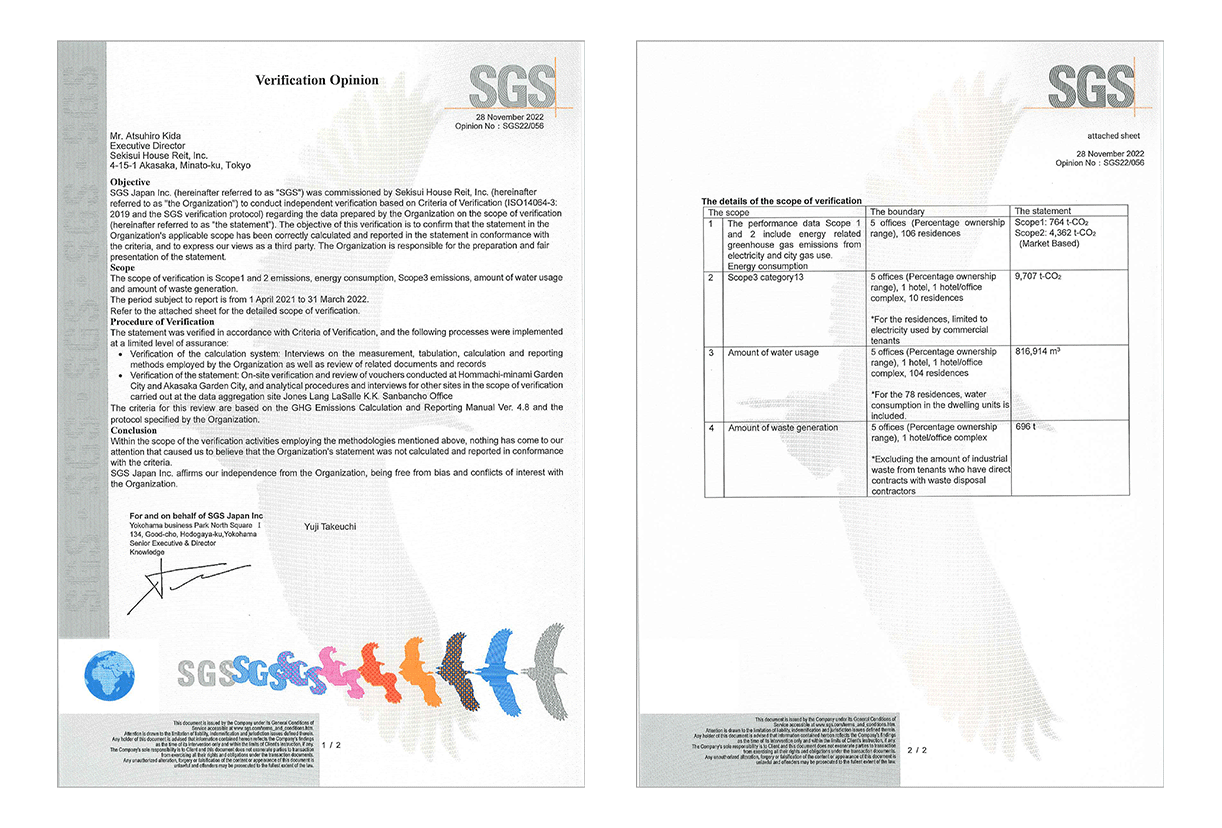
Third-Party Assurance (Verification Opinion)
In order to increase data reliability, SHR has acquired a third-party assurance for our environmental performance data from SGS Japan Inc. with the exception of some data.
Governance
Status of Use of Internal Reporting System
| Unit | FY 2020 | FY 2021 | FY 2022 | |
|---|---|---|---|---|
| Compliance Hotline | Cases | 0 | 0 | 0 |
Status of Legal Compliance
| Unit | FY 2020 | FY 2021 | FY 2022 | |
|---|---|---|---|---|
| Number of serious violations of laws and voluntary standards | Cases | 0 | 0 | 0 |
| Fines for violations of various laws and regulations | Yen | 0 | 0 | 0 |
Political Contribution
| Unit | FY 2020 | FY 2021 | FY 2022 | |
|---|---|---|---|---|
| Amount of political contribution | Yen | 0 | 0 | 0 |